We’re measuring educational opportunity in
every community in America.
We’re measuring educational opportunity in
every community in America.
The Educational Opportunity Project at Stanford University has built the first national database of academic performance. Use our Explorer to view three measures of educational opportunity in your school or community.
The Educational Opportunity Project at Stanford University has built the first national database of academic performance. Use our Explorer to view three measures of educational opportunity in your school or community.
Use our Opportunity Explorer to view 3 measures of educational opportunity:
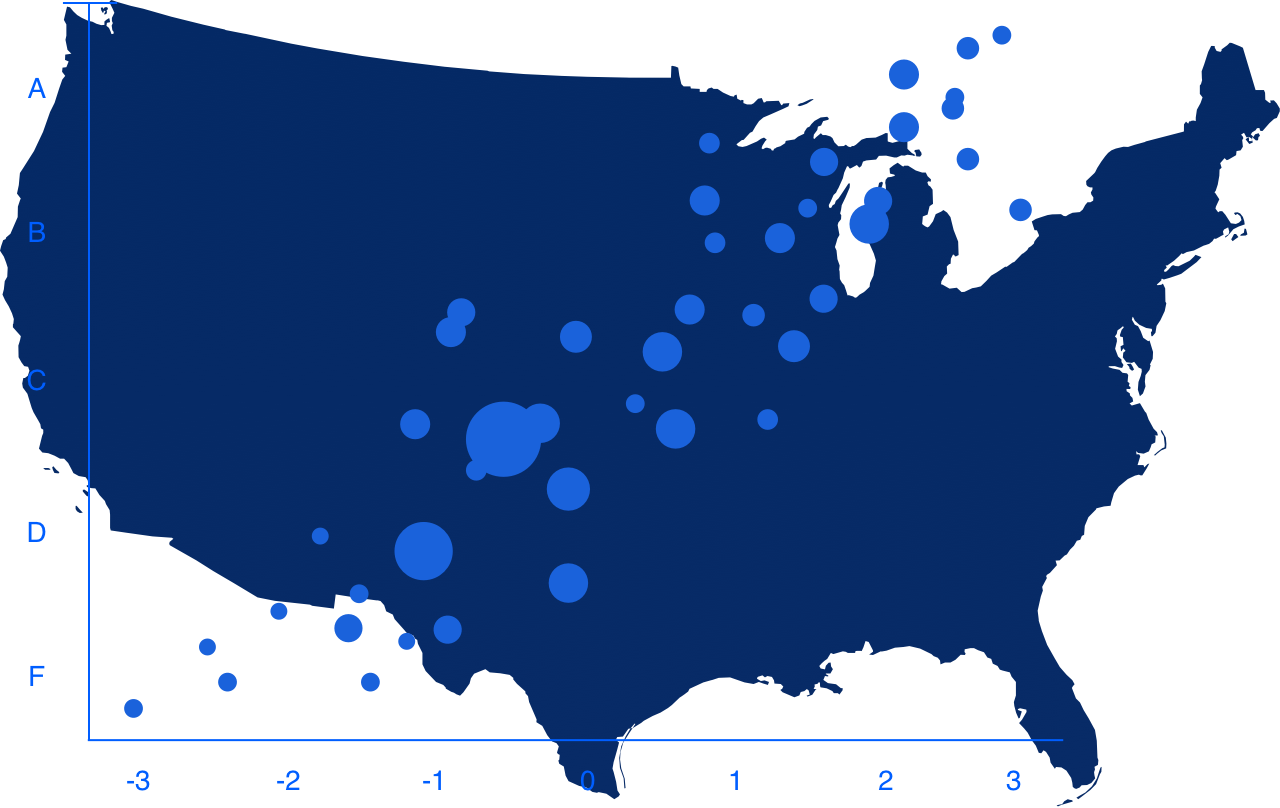
Average test scores
Average test scores
The educational opportunities available in a community, both in and out of school, are reflected in students’ average test scores. They are influenced by opportunities to learn at home, in neighborhoods, in child-care, preschool, and after-school programs, from peers and friends, and at school.
IN YOUR SCHOOL & COMMUNITY

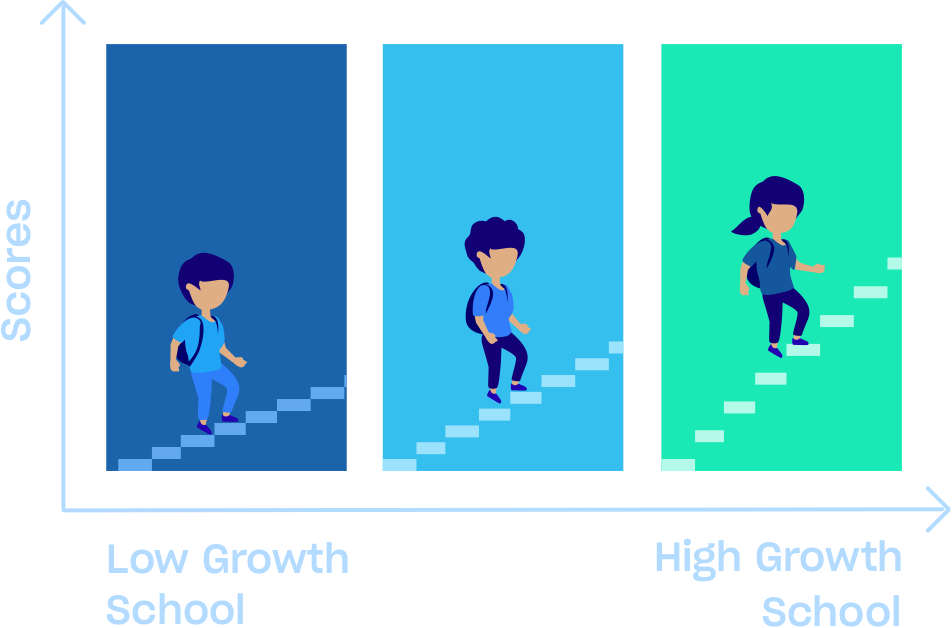
Learning rates

Learning rates
Learning rates measure how much students’ scores improve each year while they are in school. They are a better indicator of school quality than average test scores, which are influenced by a range of experiences outside of school.
YOUR SCHOOL & COMMUNITY
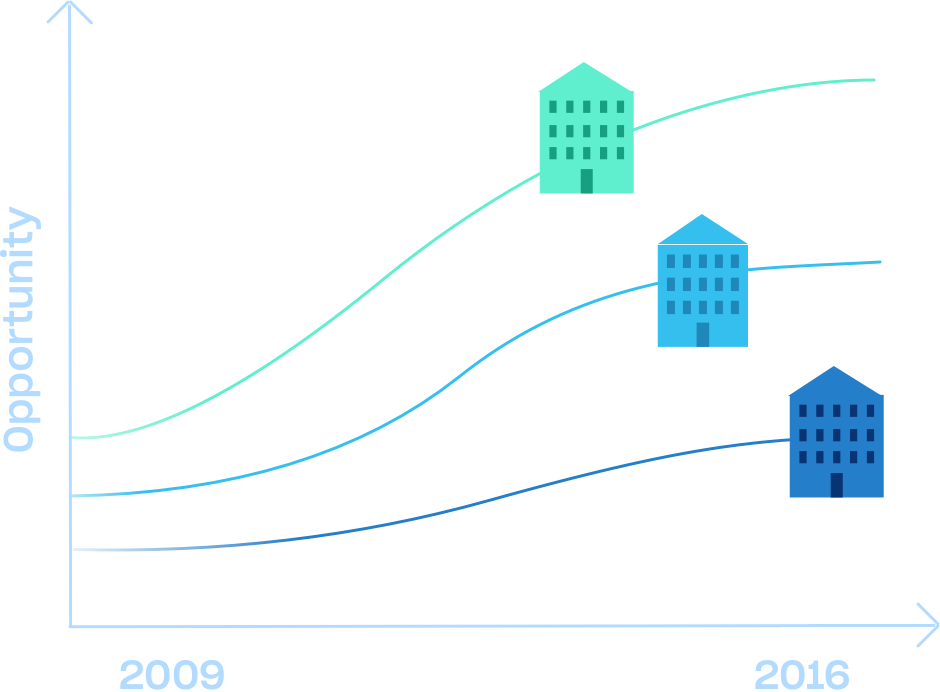
Trends in test scores
Trends in test scores
Tracking average test scores over time shows growth or decline in educational opportunity. These trends reflect shifts in school quality as well as changes in family and community characteristics.
IN YOUR SCHOOL & COMMUNITY

Ready to start exploring?
View charts and maps that show how counties, school districts, and individual schools score on these three metrics. You can also filter by demographics, explore opportunity gaps, export PDF reports, and more.
LET'S GO!

