Research
Papers produced by (and using data from) the Stanford Education Data Archive
Uneven Progress: Recent Trends in Academic Performance Among U.S. School Districts

Is Separate Still Unequal? New Evidence on School Segregation and Racial Academic Achievement Gaps
States as Sites of Educational (In)Equality: State Contexts and the Socioeconomic Achievement Gradient
The Geography of Racial/Ethnic Test Score Gaps
Educational Opportunity in Early and Middle Childhood: Using Full Population Administrative Data to Study Variation by Place and Age
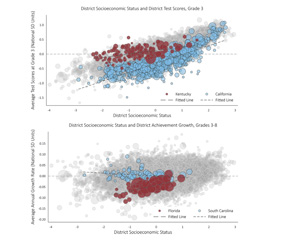
I use standardized test scores from roughly forty-five million students to describe the temporal structure of educational opportunity in more than eleven thousand school districts in the United States. Variation among school districts is considerable in both average third-grade scores and test score growth rates. The two measures are uncorrelated, indicating that the characteristics of communities that provide high levels of early childhood educational opportunity are not the same as those that provide high opportunities for growth from third to eighth grade. This suggests that the role of schools in shaping educational opportunity varies across school districts. Variation among districts in the two temporal opportunity dimensions implies that strategies to improve educational opportunity may need to target different age groups in different places.
Are public schools in the United States engines of mobility or agents of inequality? Can schools in low-income communities provide a pathway out of poverty, or are the constraints of poverty too great for schools to overcome? Such questions are at the heart of debates about the role of education in social mobility in the United States. Despite decades of research, however, we still lack clear answers.
In this article, I provide new evidence to inform these debates. It suggests that the lack of a clear answer to the question is explained in part by the substantial variation in the role of schooling in shaping educational opportunity across places. Early childhood conditions are more important in some places, educational opportunities during the elementary and middle school years more important in others.
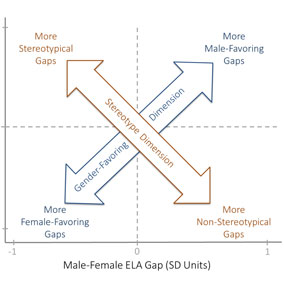
Gender Achievement Gaps in U.S. School Districts
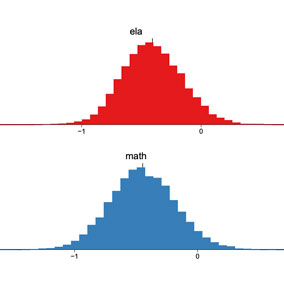
In the first systematic study of gender achievement gaps in U.S. school districts, we estimate male-female test score gaps in math and English Language Arts (ELA) for nearly 10,000 school districts in the U.S. We use state accountability test data from third through eighth grade students in the 2008-09 through 2014-15 school years. The average school district in our sample has no gender achievement gap in math, but a gap of roughly 0.23 standard deviations in ELA that favors girls. Both math and ELA gender achievement gaps vary among school districts and are positively correlated – some districts have more male-favoring gaps and some more female-favoring gaps. We find that math gaps tend to favor males more in socioeconomically advantaged school districts and in districts with larger gender disparities in adult socioeconomic status. These two variables explain about one fifth of the variation in the math gaps. However, we find little or no association between the ELA gender gap and either socioeconomic variable, and we explain virtually none of the geographic variation in ELA gaps.
To download a data file with the gender achievement gap estimates produced in this paper, please click here to sign the data use agreement. Upon signing, you will be redirected to the Stanford Education Data Archive where you can download the data file from this paper.
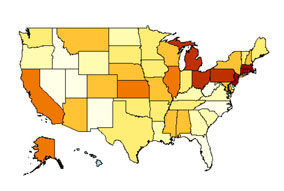
This map displays Empirical Bayes estimates of the average achievement gaps in math and English language arts in nearly 10,000 U.S. public school districts. A gap of zero indicates that there is no achievement gap in that district. Negative gaps (shown in orange) indicate that female students score higher on average than male students in the district; positive achievement gaps (shown in blue) indicate that male students score higher on average than female students in the district. The gaps displayed are in standard deviation units; for reference, a third of a standard deviation gap is approximately a one grade level difference.
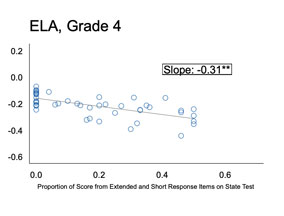
The Relationship Between Test Item Format and Gender Achievement Gaps on Math and ELA Tests in 4th and 8th Grade
How much do test scores vary among school districts? New estimates using population data, 2009-2015
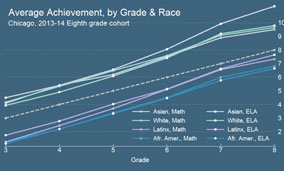
Test Score Growth Among Chicago Public School Students, 2009-2014
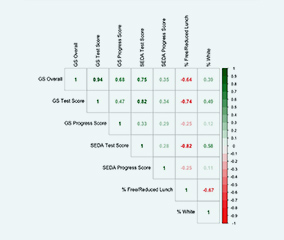
Parents’ Online School Reviews Reflect Several Racial and Socioeconomic Disparities in K–12 Education

Racial and Socioeconomic Test-Score Gaps in New England Metropolitan Areas: State School Aid and Poverty Segregation
Test-score data show that both low-income and racial-minority children score lower, on average, on states’ elementary-school accountability tests compared with higher-income children or white children. While different levels of scholastic achievement depend on a host of influences, such test-score gaps point toward unequal educational opportunity as a potentially important contributor. This report explores the relationship between racial and socioeconomic test-score gaps in New England metropolitan areas and two factors associated with unequal opportunity in education: state equalizing school-aid formulas and geographic segregation of low-income students. The underlying methods do not allow a strict causal interpretation; however, both aspects are strongly related to test-score gaps, with poverty segregation between school districts especially important in New England.
The report first explores the degree to which state school aid is progressive, that is, distributed disproportionately to districts with high fractions of students living in poverty; more progressive distributions are associated with smaller test-score gaps in high-poverty metropolitan areas. All U.S. states distribute some state revenue to support local school districts, but the extent to which such aid is focused on districts with greater concentrations of poverty varies considerably. The relationships estimated in the empirical analysis suggest that New England metro areas with high average district poverty in states with more progressive aid distributions, such as Springfield, Massachusetts, should see somewhat smaller racial and socioeconomic test-score gaps than metro areas with lower district poverty in states with less progressive school aid, such as Burlington, Vermont; that predicted difference in white-Black test-score gaps amounts to about one-quarter of the actual difference between Springfield’s gap and Burlington’s gap.
The second factor explored is poverty segregation; test-score gaps are larger in metropolitan areas where, compared with white children or higher-income children, minority children or lowincome children go to school with, or are in school districts with, more students from low-income families. Partly because school districts (and cities and towns) are relatively small geographically in New England, poverty segregation in the region’s metropolitan areas is most pronounced between districts, not between schools within school districts. The sizes of the estimated relationships suggest that metro areas with the highest between-district poverty segregation, such as BridgeportStamford-Norwalk, Connecticut, should have markedly larger test-score gaps than metro areas with moderate poverty segregation between districts, such as Manchester-Nashua, New Hampshire; those predicted differences amount to 60 percent to 90 percent of the actual test-score gap differences between the Bridgeport and Manchester metro areas.
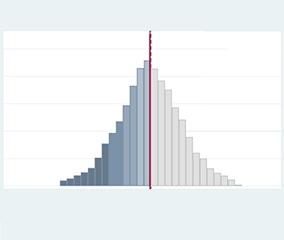
Identifying Progress Toward Ethnoracial Achievement Equity across U.S. School Districts: A New Approach
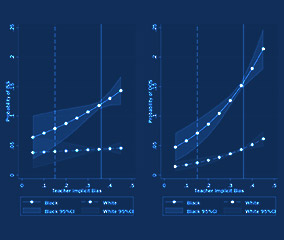
Bias in the Air: A Nationwide Exploration of Teachers' Implicit Racial Attitudes, Aggregate Bias, and Student Outcomes
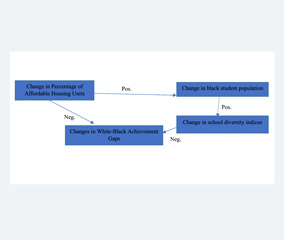
The Reversal of Mount Laurel’s Regional Contribution Agreements and the Impact on White-Black Academic Achievement Gaps Across New Jersey: 2008–2014
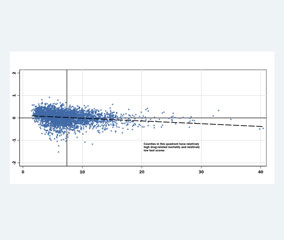
The opioid crisis and community-level spillovers onto children’s education

Effects of Four-Day School Weeks on School Finance and Achievement: Evidence from Oklahoma
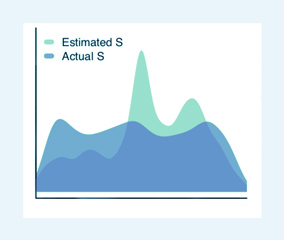
Status, Growth, and Perceptions of School Quality
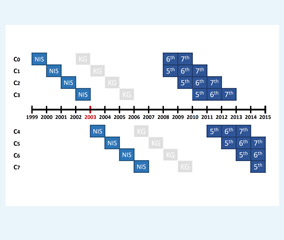
Personal Belief Exemptions for School Entry Vaccinations, Vaccination Rates, and Academic Achievement
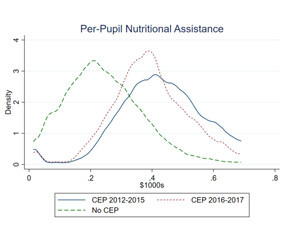
Universal Access to Free School Meals and Student Achievement: Evidence from the Community Eligibility Provision
The Effects of Student Growth Data on School District Choice: Evidence from a Survey Experiment
Are Achievement Gaps Related to Discipline Gaps? Evidence From National Data
Crime and Inequality in Academic Achievement Across School Districts in the United States
County-Level Rates of Implicit Bias Predict Black-White Test Score Gaps in U.S. Schools
Immigration Enforcement and Student Achievement in the Wake of Secure Communities
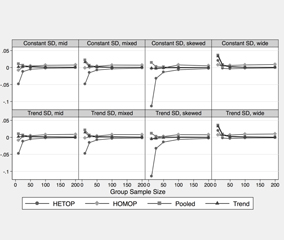
Using Pooled Heteroskedastic Ordered Probit Models to Improve Small-Sample Estimates of Latent Test Score Distributions
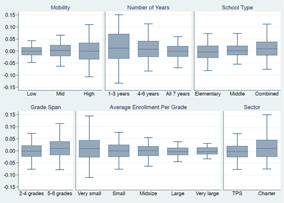
Can Repeated Aggregate Cross-Sectional Data Be Used to Measure Average Student Learning Rates? A Validation Study of Learning Rate Measures in the Stanford Education Data Archive

Stanford Education Data Archive Technical Documentation
The Stanford Education Data Archive (SEDA) is part of the Educational Opportunity Project at Stanford University (https:\edopportunity.org), an initiative aimed at harnessing data to help scholars, policymakers, educators, and parents learn how to improve educational opportunities for all children. SEDA includes a range of detailed data on educational conditions, contexts, and outcomes in schools, school districts, counties, commuting zones, and metropolitan statistical areas across the United States. Available measures differ by aggregation; see Sections I.A. and I.B. for a complete list of files and data.
By making the data files available to the public, we hope that anyone who is interested can obtain detailed information about U.S. schools, communities, and student success. We hope that researchers will use these data to generate evidence about what policies and contexts are most effective at increasing educational opportunity, and that such evidence will inform educational policy and practices.
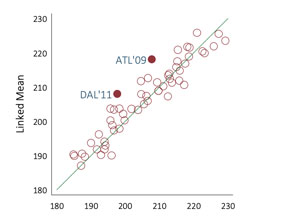
Validation methods for aggregate-level test scale linking: A case study mapping school district test score distributions to a common scale
Using Heteroskedastic Ordered Probit Models to Recover Moments of Continuous Test Score Distributions from Coarsened Data
Practical Issues in Estimating Achievement Gaps from Coarsened Data
Estimating Achievement Gaps from Test Scores Reported in Ordinal "Proficiency" Categories
Long-Term Trends in Private School Enrollments by Family Income
Income Segregation between Schools and School Districts

60 Years After Brown: Trends and Consequences of School Segregation
Since the Supreme Court’s 1954 Brown v. Board of Education decision, researchers and policymakers have paid close attention to trends in school segregation. While Brown focused on black-white segregation, we review the evidence regarding trends and consequences of both racial and economic school segregation. In general, the evidence regarding trends in racial segregation suggests that the most significant declines in black-white school segregation occurred at the end of the 1960s and the start of the 1970s. Although there is disagreement about the direction of more recent trends in racial segregation, this disagreement is largely driven by different definitions of segregation and different ways of measuring it. We conclude that the changes in segregation in the last few decades are not large, regardless of what measure is used, though there are important differences in the trends across regions, racial groups, and institutional levels. Limited evidence on school economic segregation makes documenting trends difficult, but in general, students are more segregated by income across schools and districts today than in 1990. We also discuss the role of desegregation litigation, demographic changes, and residential segregation in shaping trends in both racial and economic segregation.
One of the reasons that scholars, policymakers, and citizens are concerned with school segregation is that segregation is hypothesized to exacerbate racial or socioeconomic disparities in educational success. The mechanisms that would link segregation to disparate outcomes have not often been spelled out clearly or tested explicitly. We develop a general conceptual model of how and why school segregation might affect students and review the relatively thin body of empirical evidence that explicitly assesses the consequences of school segregation. This literature suggests that racial desegregation in the 1960s and 1970s was beneficial to blacks; evidence of the effects of segregation in more recent decades, however, is mixed or inconclusive. We conclude with discussion of aspects of school segregation on which further research is needed.
Brown Fades: The End of Court-Ordered School Desegregation and the Resegregation of American Public Schools

The widening academic achievement gap between the rich and the poor
Publication: Community Investments: Summer 2012
Almost fifty years ago, in 1966, the Coleman Report famously highlighted the relationship between family socioeconomic status and student achievement. Family socioeconomic characteristics continue to be among the strongest predictors of student achievement, but while there is a considerable body of research that seeks to tease apart this relationship, the causes and mechanisms of this relationship have been the subject of considerable disagreement and debate. Much of the scholarly research on the socioeconomic achievement gradient has focused largely on trying to understand the mechanisms through which factors like income, parental educational attainment, family structure, neighborhood conditions, school quality, as well as parental preferences, investments, and choices lead to differences in children’s academic and educational success. Still, we know little about the trends in socioeconomic achievement gaps over a lengthy period of time.
The question posed in this article is whether and how the relationship between family socioeconomic characteristics and academic achievement has changed during the last fifty years, with a particular focus on rising income inequality. As the income gap between high- and low-income families has widened, has the achievement gap between children in high- and low income families also widened? The answer, in brief, is yes. The achievement gap between children from high- and low-income families is roughly 40 percent larger among children born in 2001 than among those born twenty-five years earlier.